HubSpot CRM is a fantastic tool that provides detailed tracking from the first contact to closed deal, but getting access to that detailed sales data can be a pain in the ass. The Reports Add-on is about 70% there, which is good; but when you have competitive sales reps that get compensated for their activities, or a CEO that wants to know everything that's going on, it falls short. I plan to continually update this post with tips and workarounds to gain access to sales data to prevent any internal issues around reporting.
I've met with the HubSpot team that created the Reports Add-on and have suggested features like team filtering, and other useful tools. I continually communicate with HS support and research way to solve sales data reporting issues brought up by my customers. If you have any special requests or would like to see another type of report fix posted here, schedule some time to chat with me and I will be more than happy to help out.
Let's start with a simple one.
How to track HubSpot deal movement over time
The ask: Would like to create a report that lists deals that entered a stage in a given date range of a specific pipeline.
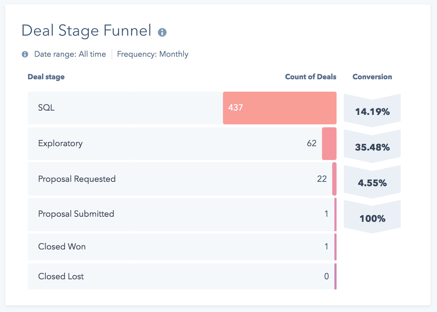
The problem with the deal funnel report generated for this type of request typically shows a pretty graph containing the count of deals that sequentially moved between stages. It will not include deals that skipped a stage, and it will not allow you to view the actual deals from the report.

As a CEO, I would like to see, specifically, which deals entered the proposal submitted stage for January? The accuracy of data is also very important to me; I want to make sure any deals that went from Exploratory Call to Proposal Submitted are included in my report.
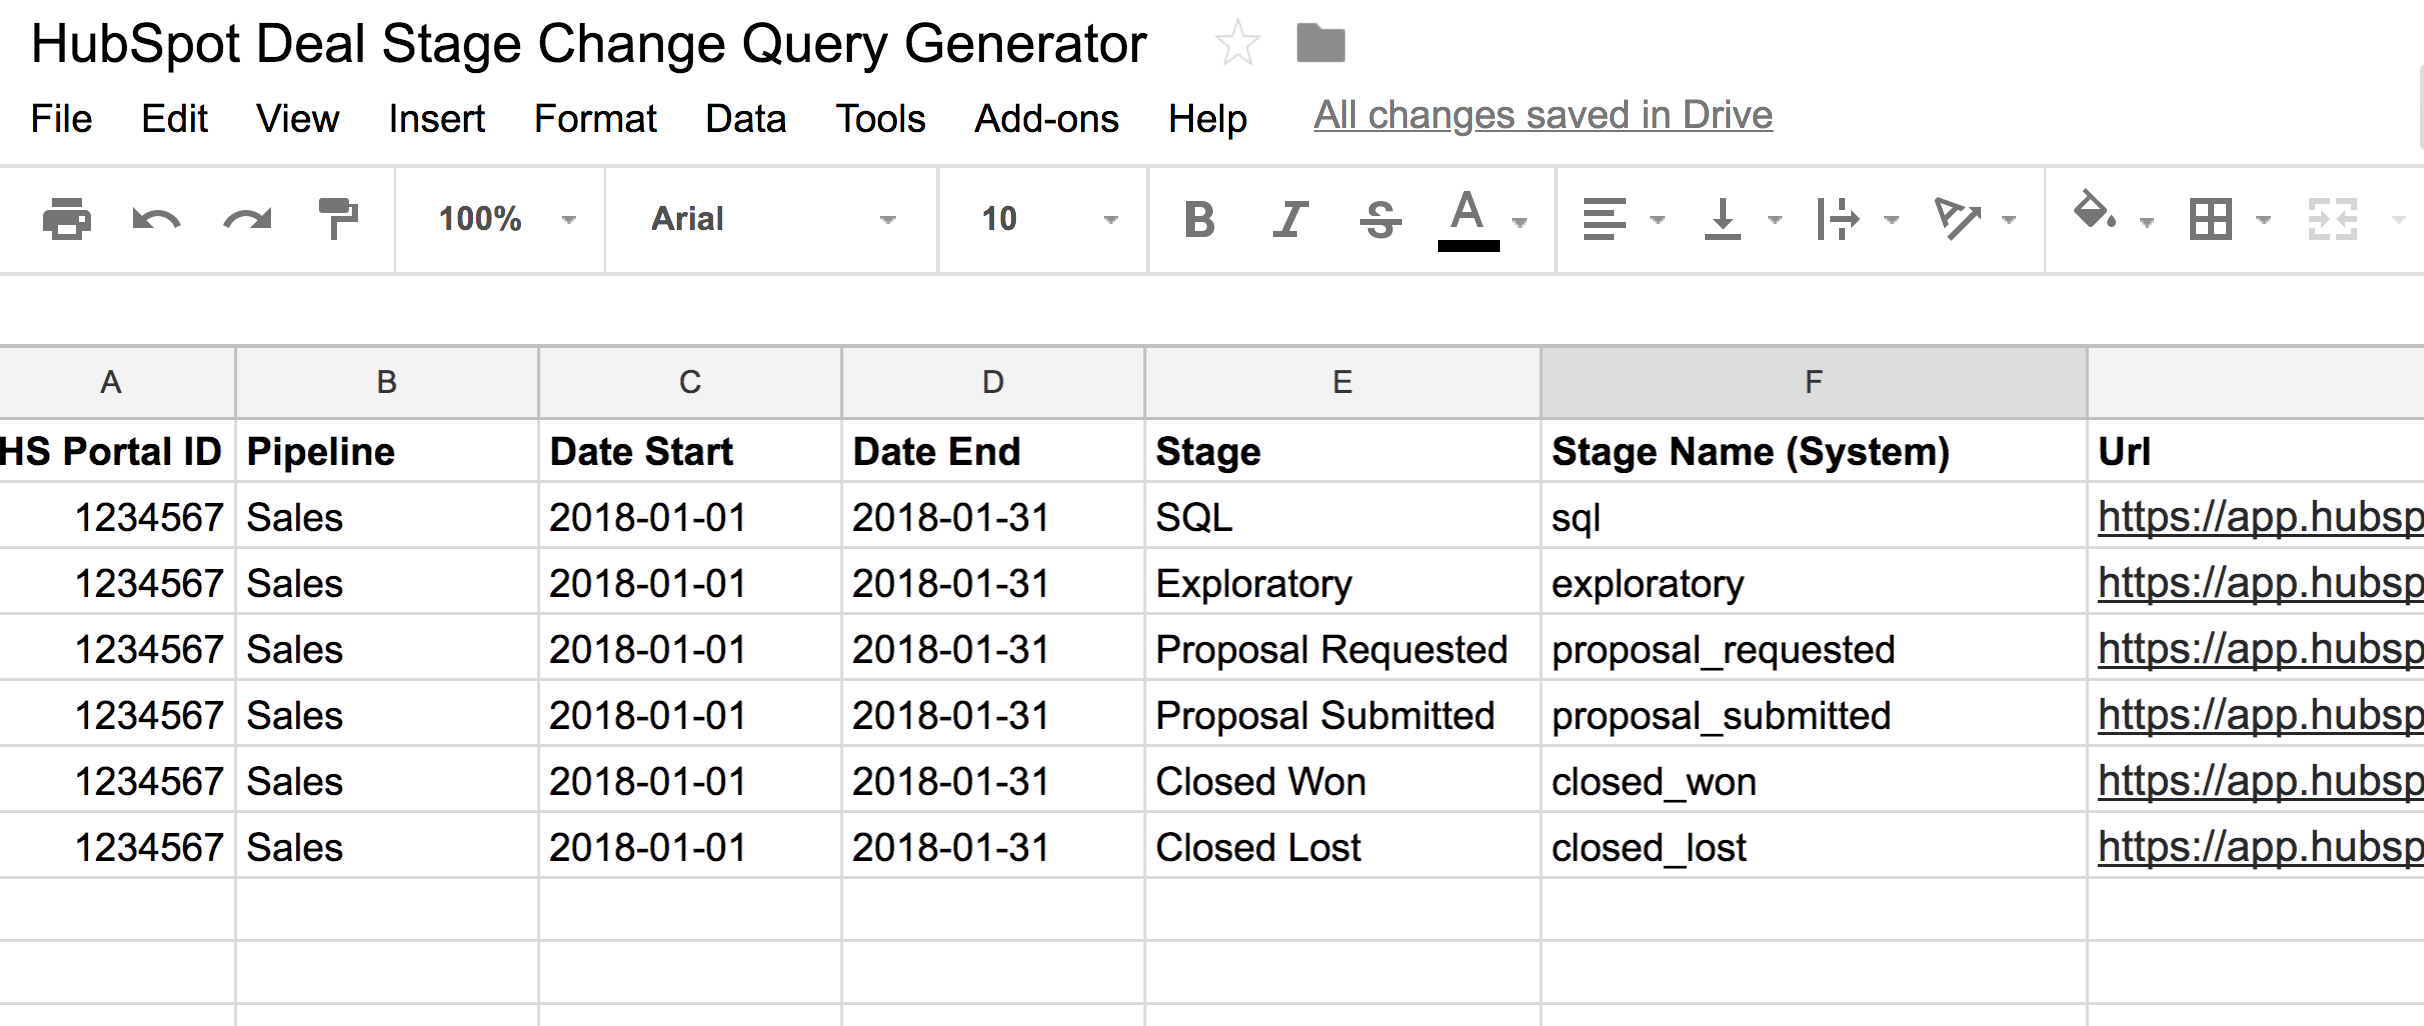
I've created a spreadsheet that will generate a URL to query the deals database and show a filtered list of deals that entered a specific stage in a given time period. I'll walk through the sheet and explain how it works. Click the image of the sheet or visit the HubSpot Stage Deal Change Query Generator and make a copy for yourself.
The above Google Sheet is setup to include all items necessary to create a custom query for your portal. Let's start by identifying each column below.
HS Portal ID: This is the portal ID for the HubSpot account in which the reports will be generated. This can be found by looking in the top right corner of the HubSpot portal listed as "Hub ID: 1234567."
Pipeline: If you maintain several pipelines, specify the pipeline for each row.
Date Start: Start date of the report - must be in YYYY-MM-DD format. If you wish to create a report starting on January 1, 2018 - enter 2018-01-01.
Date End: End date of the report - must be in YYYY-MM-DD format. If you wish to create a report starting on January 31, 2018 - enter 2018-01-31.
Stage: This is the stage of the pipeline as seen in your reports and deal board.
Stage Name (System): This is the system name for the stage. This can be found via API or inspecting code on reports. NOTE: The system stage name is different from the visible stage name.
URL: This is the URL that is generated and will produce the list of deals that have entered a stage. You will be able to visit this link directly from Google Sheets, or copy and paste it into your browser. You should be logged in to HubSpot prior to accessing this link.
I hope this sheet helps improve your sales reporting efforts. Feel free to add any additional filtering to the Sheet. I'd love to see other great ways to access sales data in the CRM.
If you have any questions or would like help setting up this or any other custom report for HubSpot please feel free to book some time with me using the tool below.


